
Services
From orbit to a decision on the ground
Three services, built to be run by the institution that owns them. Each one starts from the decision someone needs to make and works backward to the data.
Earth-observation analytics
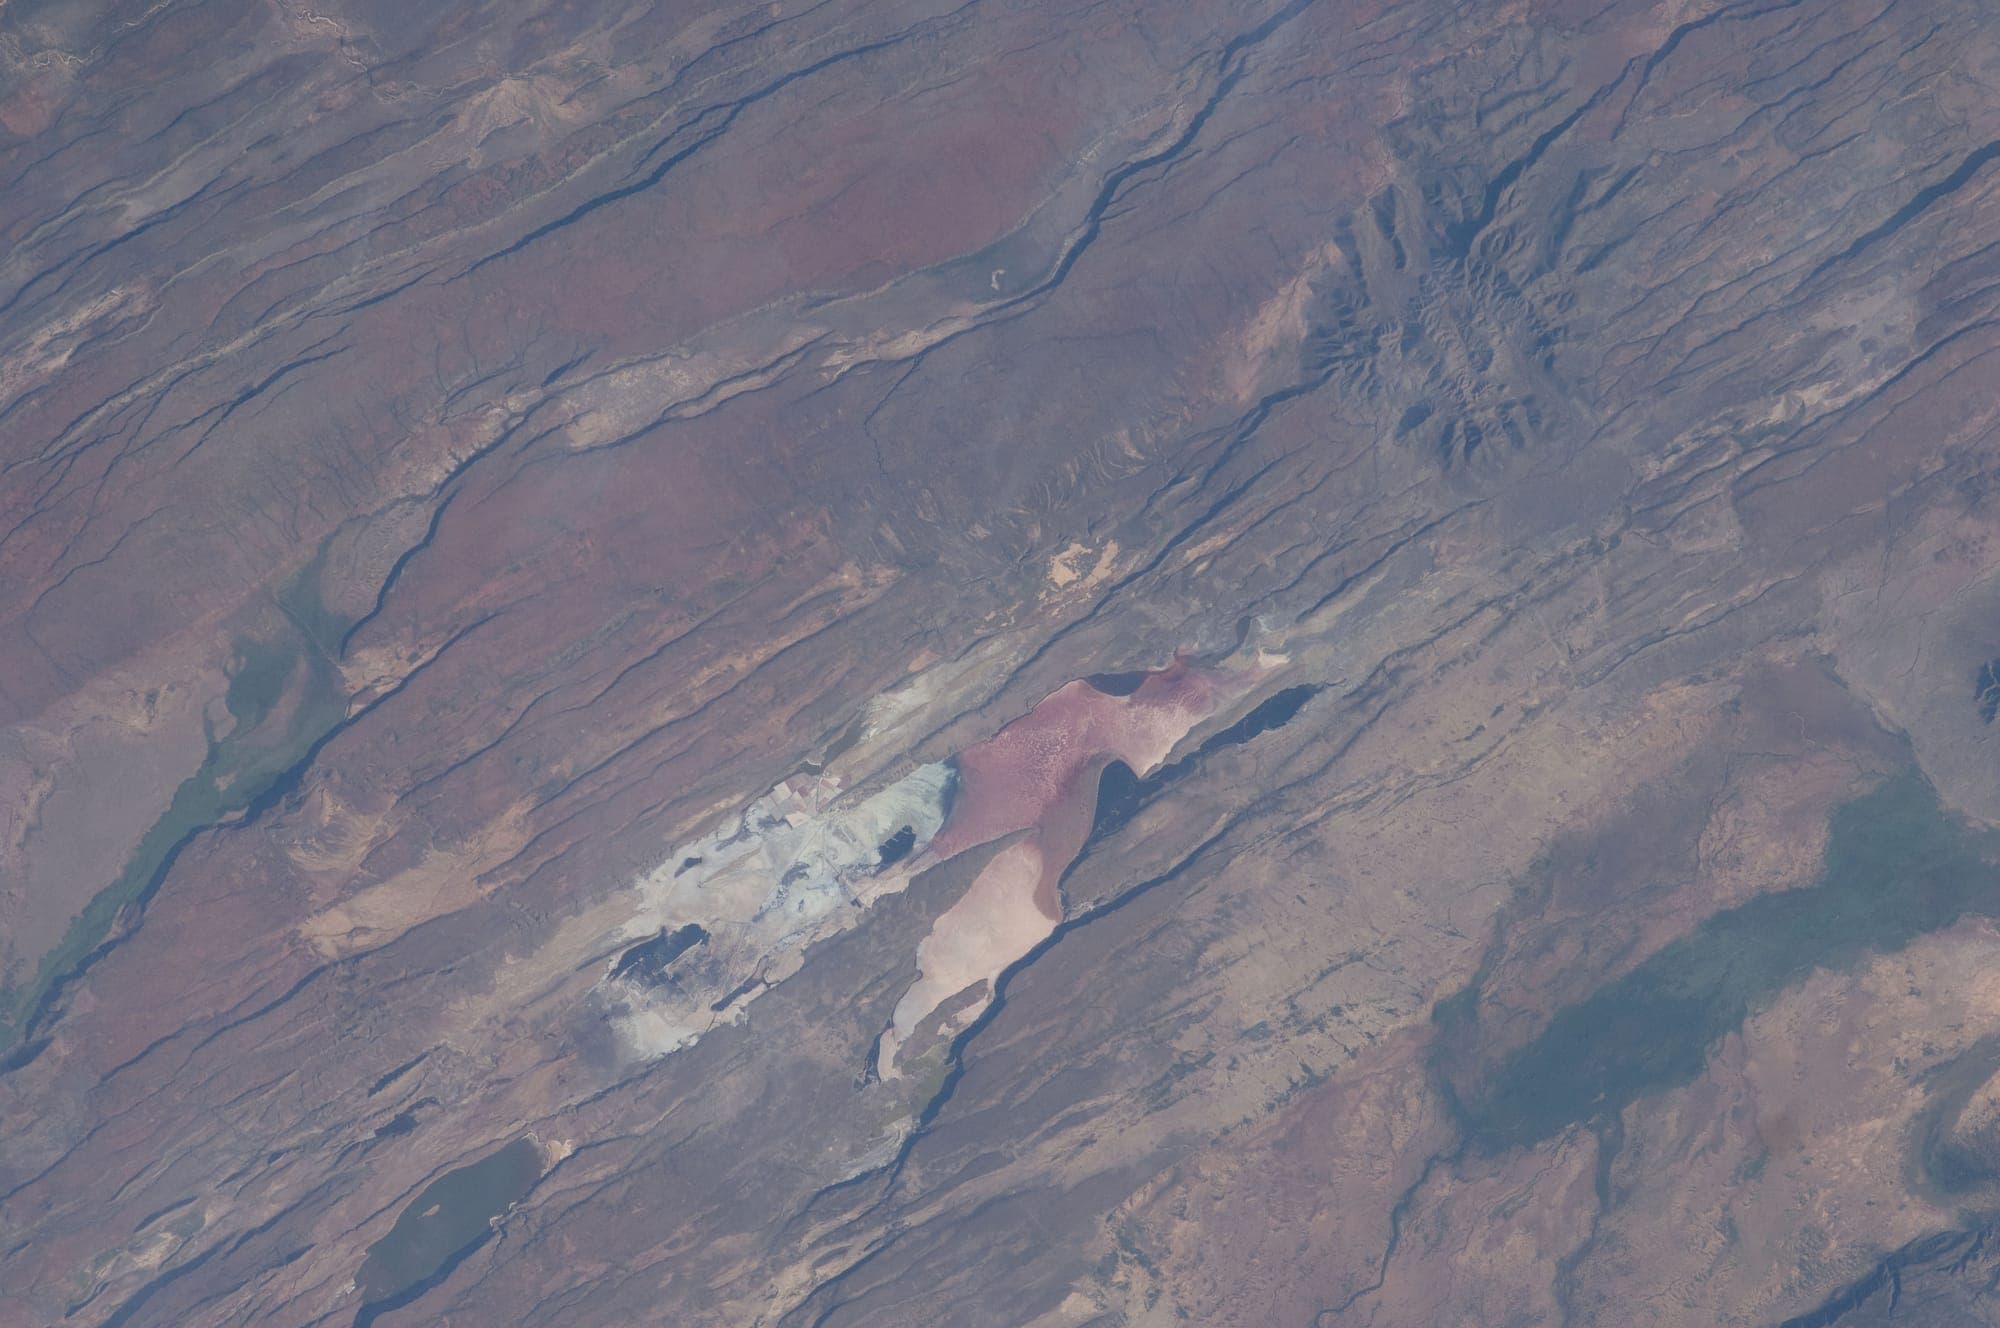
Most of the data an institution needs about land, water and weather in Tanzania is already being collected from orbit, free of charge, every few days. Very little of it reaches a decision. We build the processing that turns raw scenes into the indicator somebody was actually asking for: vegetation stress in a district, flood extent after a storm, change in a forest boundary, surface water through a dry season.
What you get
- Analysis-ready indicators from Sentinel-1/2, Landsat and Digital Earth Africa
- Region- and district-level maps with alert thresholds
- Time-series monitoring: vegetation, water, land-use change
- Delivered as dashboards, exports, or a data feed into your own systems
Early-warning & bulletin systems
A warning is only useful if it reaches the right desk, in the right format, before the event. We build the systems that take forecast and observation data from several agencies, apply the impact logic, draw the maps, and produce the bulletin — as a document people already recognise — with the audit trail a public institution needs.
What you get
- Role-based multi-agency input: meteorology, water, geology, health, agriculture, environment
- Automatic map generation with alert levels by region or district
- Bilingual (English / Kiswahili) bulletin templates, DOCX and PDF
- Scheduled generation, delivery and a full history and audit log
Geospatial data platforms
Every institution has met the system that worked for the length of the donor contract and then stopped. We build the unglamorous part properly: ingestion that retries, a spatial database with real access control, dashboards that a district officer can read on a phone, and documentation your own team can maintain.
What you get
- Automated ingestion from satellite catalogues, stations and agency systems
- PostGIS-backed spatial database with role-based access
- Dashboards and reporting readable on any browser or phone
- Handover: documentation, training, and the ability to run it without us

How we work
Output first, imagery second
- 01
Scope
Which decision, which desk, how often. We start from the output, not the imagery.
- 02
Prototype
A first indicator, map or bulletin on your real data within weeks — so the conversation becomes concrete.
- 03
Build
Pipelines that retry, a spatial database with access control, dashboards readable on a phone.
- 04
Hand over
Documentation and training so your own team can run it. We stay on for what needs us.